

Negative power prices 2024 - analysis & solutions
On this page
- Development of negative imbalance & EPEX prices 2024
- Renewable energy 2024
- Outlook negative prices 2024-2026
- European developments: negative prices & supergrid
- Solutions for negative prices
- Annual review 2023 negative prices imbalance market
- Renewable energy in the Netherlands 2023
- Retrospective negative prices from 2019
- COMCAM advice
Analysis of negative power prices caused by an oversupply of solar and wind power, with possible solutions.
A lot of wind and solar power is being generated. So much, in fact, that the market power price is increasingly negative during the day when there is excess supply. As a result, more and more generation installations are being curtailed.
At these moments, renewable generation exceeds demand, with insufficient scope to export the power surplus to neighbouring countries.
Read on for more insight and background, an outlook and possible solutions for how to deal with negative power prices for your solar or wind installation.
Development of negative imbalance & EPEX prices 2024 Renewable energy 2024 Outlook negative prices 2024-2026 European developments: negative prices & supergrid Solutions for negative prices Annual review 2023 negative prices imbalance market Renewable energy Netherlands 2023 Retrospective negative prices from 2019 COMCAM advice
Development of negative imbalance & EPEX prices 2024
The imbalance market - how does it work
Imbalance trading responds to real-time needs and fluctuations in the electricity grid. Imbalance is the difference that arises between forecast and actual supply and demand on the electricity grid. This difference can be caused by unexpected changes in the weather, outages at power plants, or sudden changes in renewable generation or in consumption.
Grid operators have to correct this imbalance quickly to keep the electricity grid stable. Prices in this market can fluctuate sharply, depending on the shortage or surplus of electricity. Because of the further growth in the volume of renewable energy generated and the electrification of transport and business processes, imbalance is expected to increase over the coming decade.
Temporary delay in TenneT imbalance data from 3 December 2024
TenneT has decided to provide participants in the imbalance market with data every five minutes instead of every two minutes. The grid operator took that decision because it has recently been seeing too many fluctuations on the national electricity grid, partly caused by batteries trading energy.
The grid operator has been struggling for some time with large and rapid fluctuations, which is also visible in the high number of quarter-hours in which regulation state 2 applies. Regulation state 2 occurs when there is both a surplus and a shortage of electricity on the grid within a single quarter-hour. This often happens because large energy producers, such as solar or wind farms, adjust their output quickly in response to current imbalance prices.
The measure takes effect on 3 December from 9.00 a.m. It is a temporary measure that will apply for at least six months. The aim is to limit fluctuations in the frequency of the electricity grid. TenneT's goal is to return to the current delay as soon as possible.
Negative price hours 2024
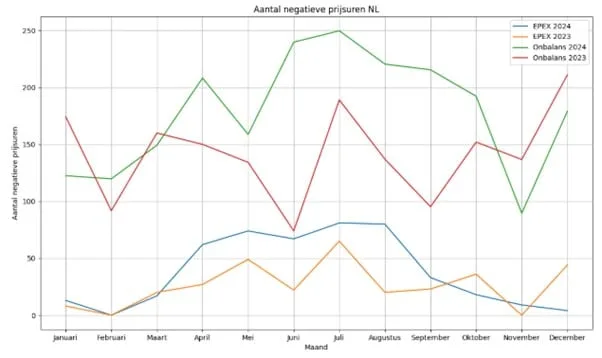
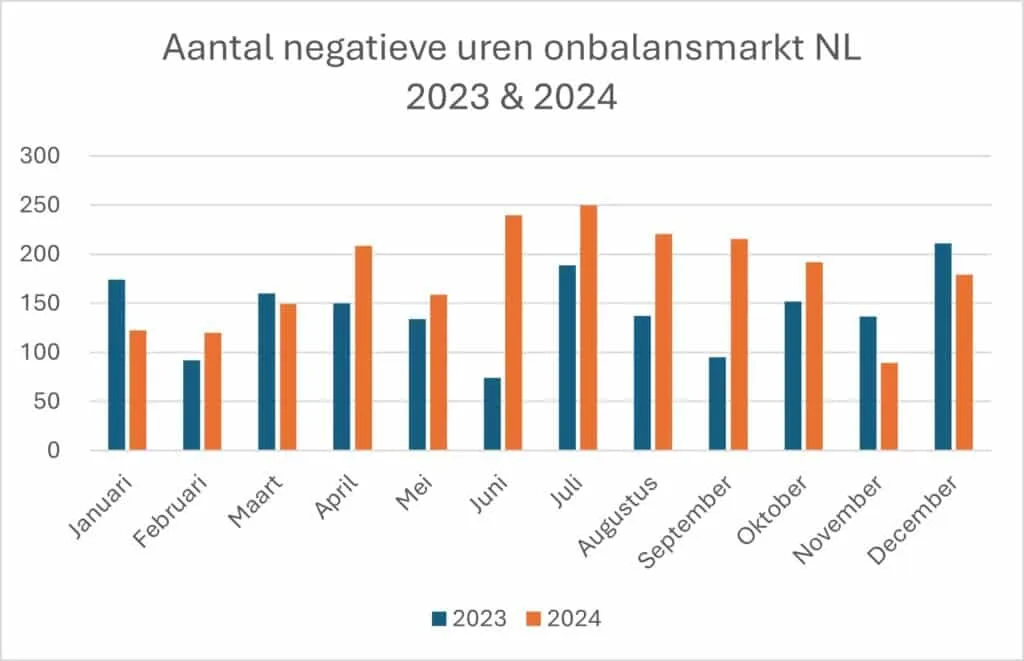
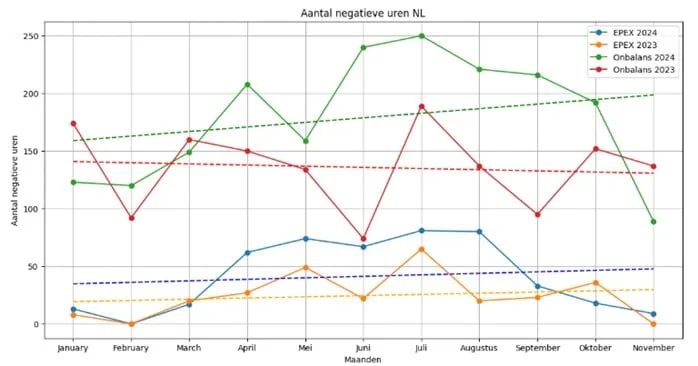
There were 2,145 negative price hours on the imbalance market in 2024. That is an increase of 440 hours compared with 2023. In 2024 there was a great deal of volatility, which resulted in more extremely cheap hours as well as more extremely expensive hours than in previous years.
In November there were only 89.5 negative price hours, the lowest number of hours in any month this year. This month, the Netherlands faced a period with little sun and wind, also known as a "dunkelflaute". Because of this low output from solar and wind power, there was a greater dependence on fossil fuels. TenneT had to deploy more emergency capacity to keep the grid stable. As a result, imbalance prices were higher than usual this month.
Because of the temporary delay in the imbalance data, TenneT expects fewer fluctuations on the electricity grid. This temporary arrangement runs from 3 December 2024 to 3 June 2025.
In 2023 there were a total of 1,705 negative hours on the imbalance market.
EPEX market (day-ahead)
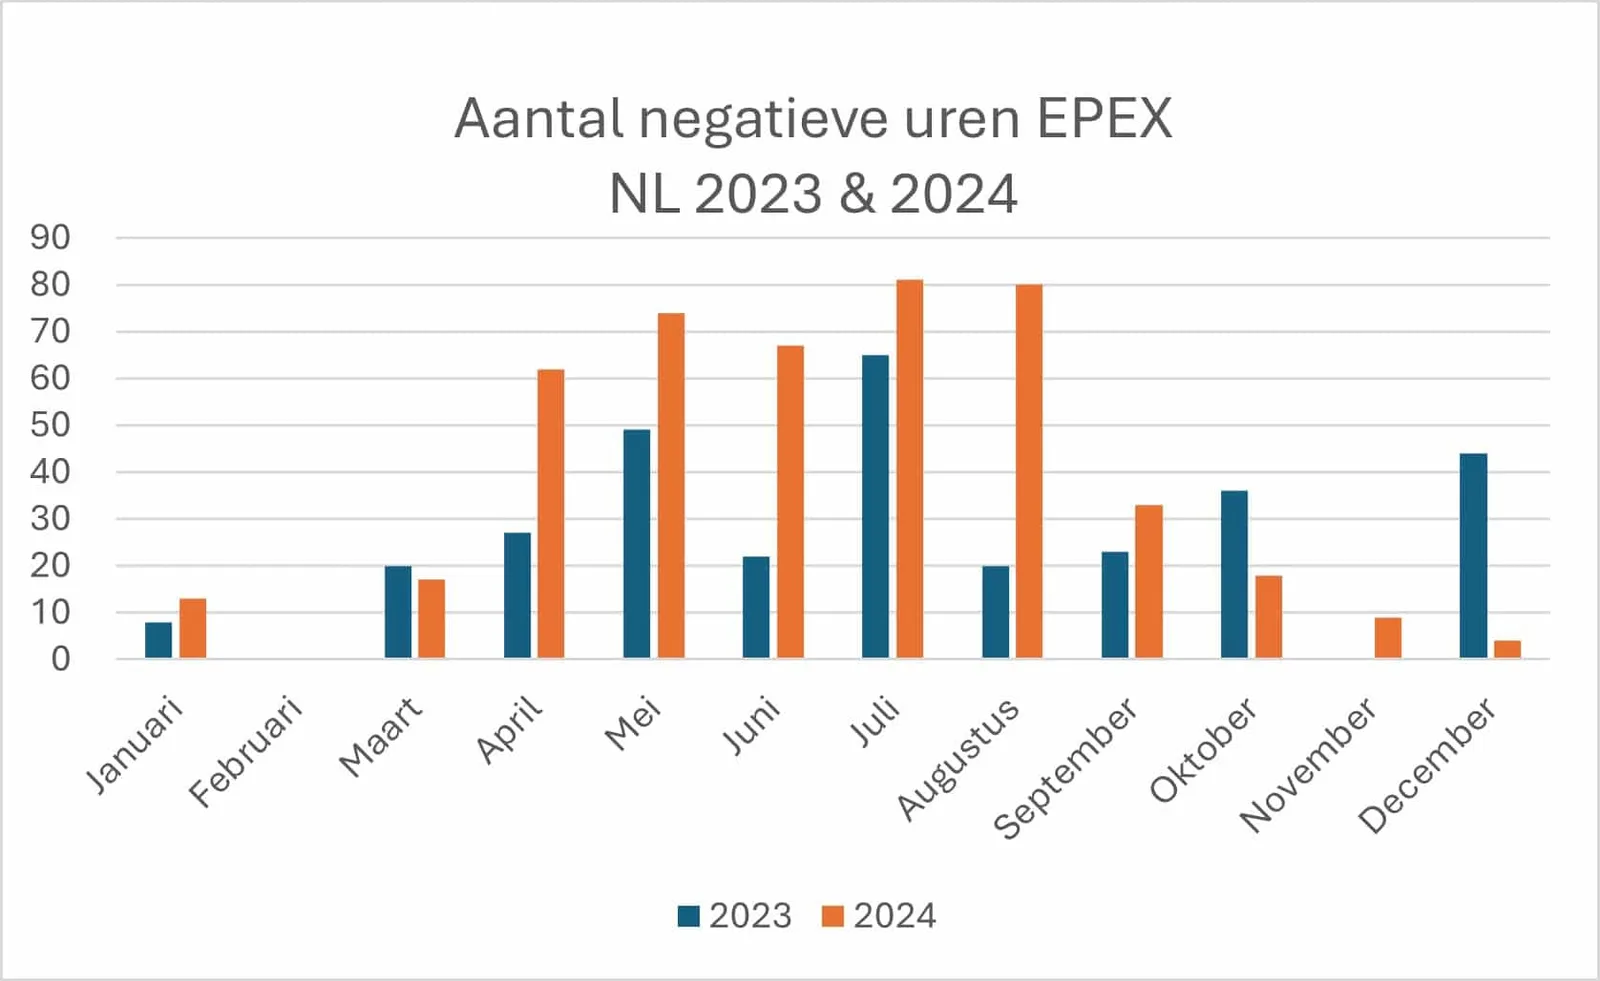
Day-ahead prices are a forecast of electricity prices for the following day. In 2024 there were a total of 458 negative price hours on the day-ahead market. An increase of 144 hours compared with 2023.
In November there were only 9 negative price hours. This month, the Netherlands faced a period with little sun and wind, also known as a "dunkelflaute". Day-ahead prices rose considerably because of the reduced renewable output and the higher demand for electricity caused by colder weather. This resulted in fewer negative price hours compared with earlier months, but prices were more volatile.
In 2023 there were a total of 314 negative hours on the EPEX market.
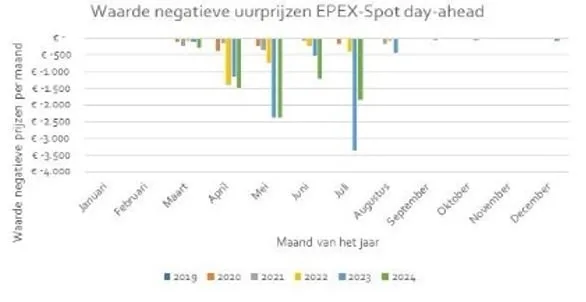
On average, the negative prices in 2024 were less negative than in previous years.
Curtailment at negative prices
At moments with negative prices and at zero prices, more and more generation installations are being curtailed because of oversupply and grid congestion. The total volume of curtailed electricity for 2024 is estimated at more than 3 terawatt-hours, three times as much as in 2023.
The volume of curtailed generation capacity is likely only to grow further. This is because a great deal of wind and solar capacity will be added in the coming years. Electricity demand is expected to grow more slowly. Read more about this here.
From 2025, EPEX will work with quarter-hourly prices instead of hourly prices. What does this mean?
Renewable energy 2024
A first in 2024: more than half green electricity
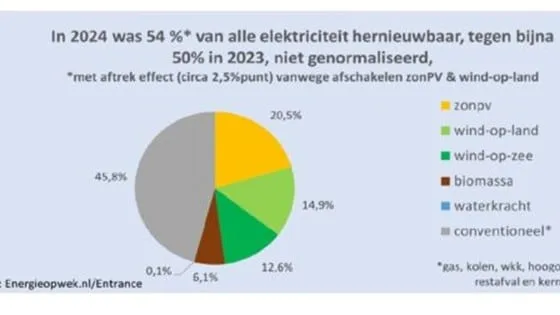
Of all the electricity produced, 54.2% was green in 2024. The share could have been 56.5% without the switching off of wind turbines and solar panels. The total volume of curtailed electricity for 2024 is estimated at more than 3 terawatt-hours, three times as much as in 2023. If all these surpluses had been stored for later use, another 250 million cubic metres of natural gas would have been saved, according to figures from Energieopwek.
Growth across the whole of 2024 was 11%. Electricity production from wind turbines (+14 percent) and solar panels (+15 percent) contributed most to this. The main reason is that two offshore solar parks came into production and the number of installed solar panels continued to grow.
In 2024, solar panels supplied 20.5% of all the electricity required, onshore wind turbines 14.9%, offshore wind turbines 12.6% and biomass 6.1%.
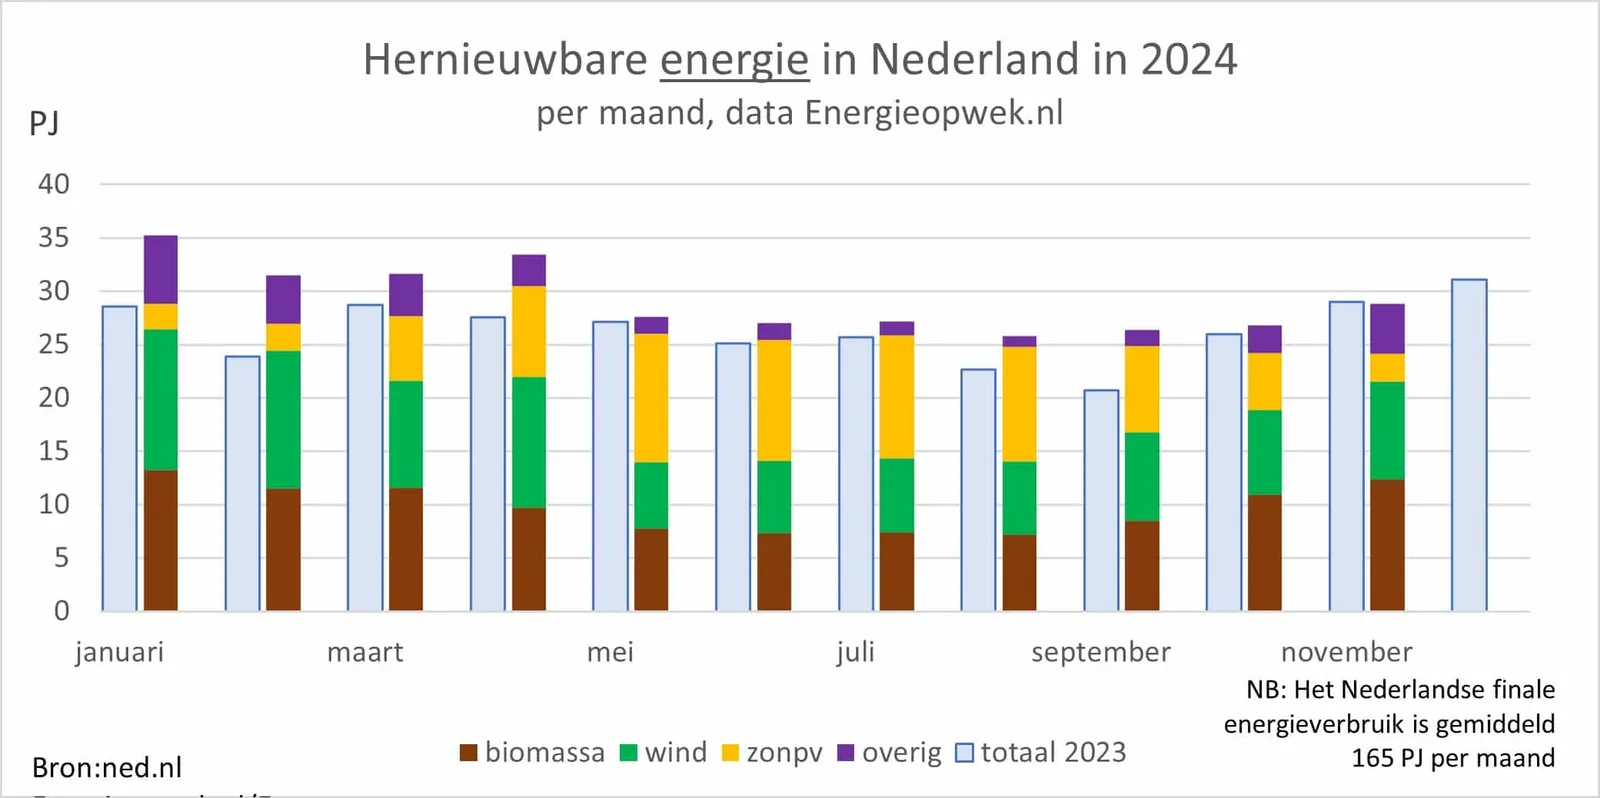
In 8 of the 12 months, green electricity production was above 50%. April was the best month, at more than 68%. The windless and grey month of November was the worst month, at 38 percent. This was also the only period in which renewable energy production fell slightly compared with the same month a year earlier.
November 2024
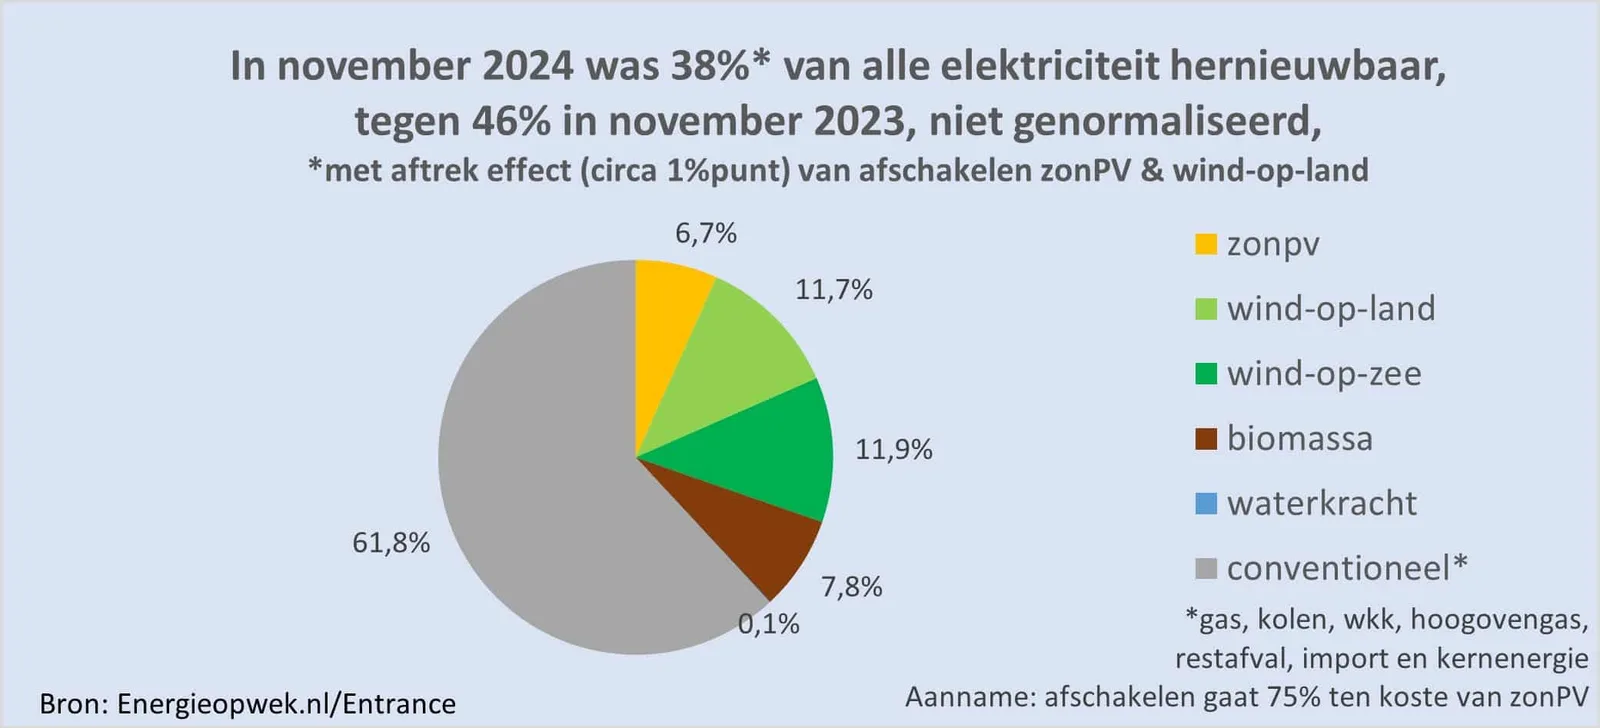
Because of a lack of wind, only 38% of all electricity was renewable. The storm at the end of this month even had a negative effect: all wind turbines were shut down to prevent damage. If that had not happened, 39% of all electricity would have been green. In November last year, 50% still came from renewable sources.
This decline was partly offset by other renewable sources. Solar panels supplied 20% more electricity. However, at this time of year the sun is weak and the days are short. Heat pumps did play their part. This month they supplied 1 petajoule of energy, comparable to 30 million cubic metres of natural gas, 5% more than last year. Biomass also had to step in considerably. Coal-fired plants co-firing biomass supplied 8 percent of all electricity over the past month.
October 2024
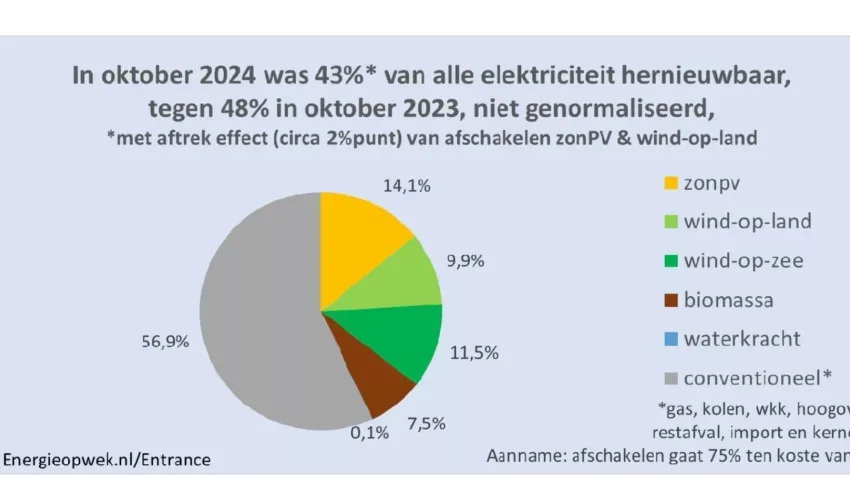
In the windless month of October, renewable electricity production fell sharply to 43%. Wind turbines supplied 21.4% of the electricity generated this month, and the solar share was 14.1%. This, combined with higher energy demand, meant that renewable sources supplied only 43% of the electricity required this month. It could have been 45% if producers had been able to store their electricity instead of switching off their solar or wind installation because of negative power prices. The renewable share in the same period in October 2023 was 53%.
September 2024
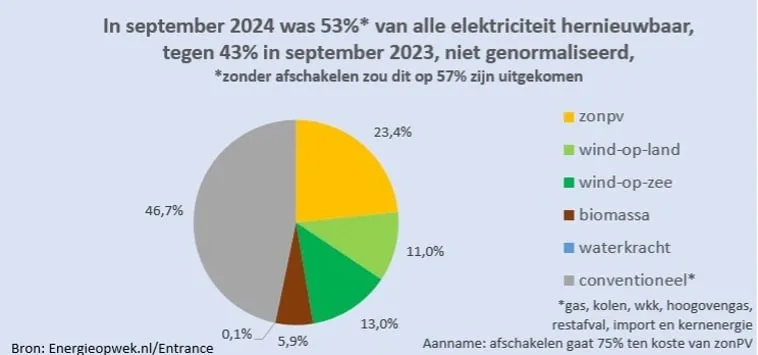
It was the seventh month in a row in which more than half of all electricity generated in the Netherlands was green. In September, 53% of electricity came from renewable sources. Without the curtailment of wind turbines and solar panels, this would have been 57%. The growth in renewable production again regularly led to surpluses in September, resulting in negative power prices.
Electricity production from wind turbines almost doubled in September compared with the same month last year. This was because it was very windy and because many new wind turbines were added, particularly offshore. Electricity production from solar panels grew by 7%. This could have been 16% if producers had been able to store their electricity instead of switching off the solar panels because of negative power prices.
August 2024
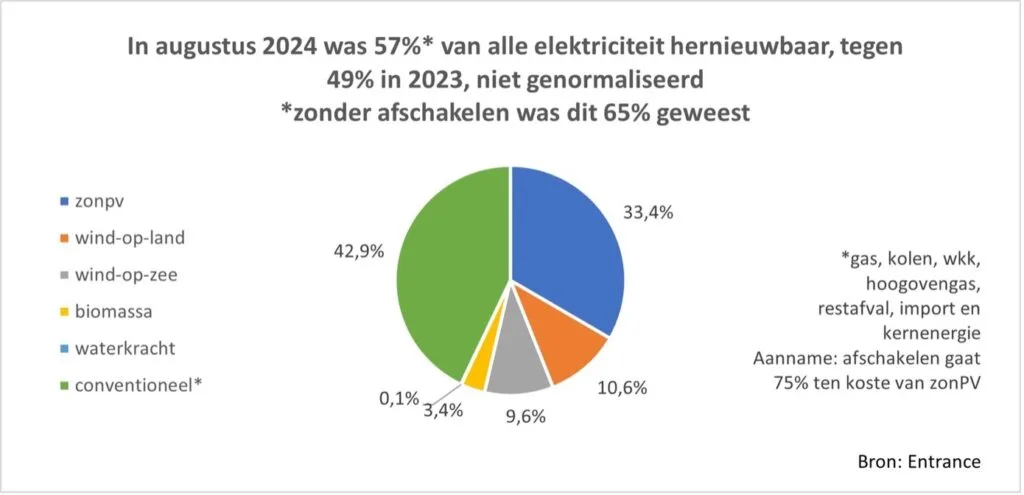
In August, renewable energy production was 12% higher than last year. Solar panels supplied 42% of all electricity. The share of wind remained limited to 20% because of less wind. Even so, the wind share was higher than last year because more offshore wind farms have been added.
In this month, 57% of all electricity generated was renewable, a growth of 8% compared with August 2023. Without the curtailment of wind and solar farms, the share could even have been 65%.
July 2024
In July, solar panels supplied 37.8% of all electricity. Because there was less wind, wind turbines supplied only 21.8% of all electricity. In this month, 63% of all electricity generated was renewable.
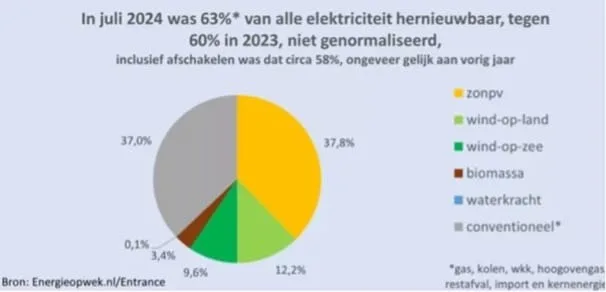
Because of the curtailment of wind and solar farms, only 58% was used. In July, less electricity could be exported because, among other things, the BritNed cable was out of use for almost the entire month. This led to more supply than demand, more moments with negative prices and more curtailment of solar and wind power. As a result, around 11% of the yield for solar and wind farms was lost this month.
In July there were 81 hours with a negative power price on the EPEX market. On the imbalance market there were 250 hours with a negative price. For both markets an all-time high.
June 2024
In June, 64% of all electricity was renewable. Solar panels made the largest contribution to renewable production, followed by wind. The biomass share in June was the lowest of the whole year.
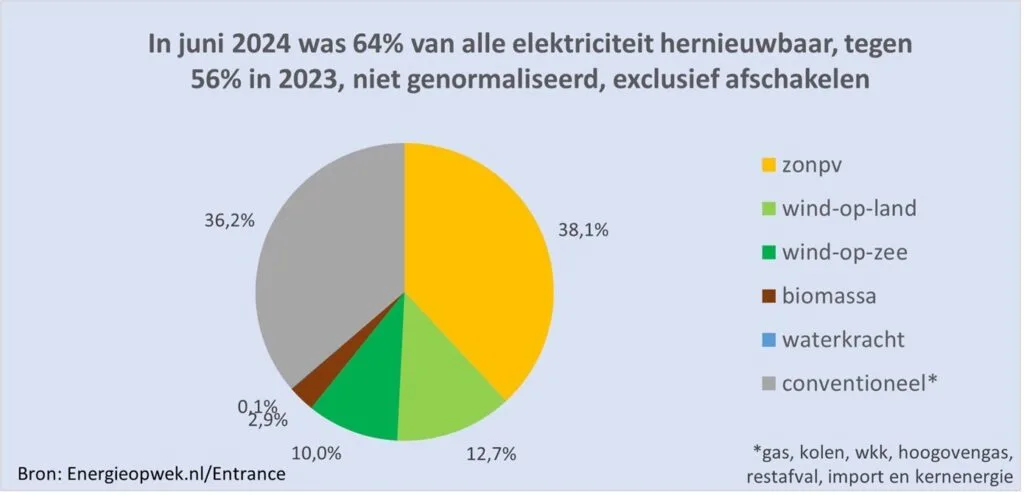
In June there were 67 hours with a negative power price on the EPEX market. On the imbalance market there were 240 hours with a negative price.
May 2024
The volume of renewable energy grew by 7%, despite less sun and wind. The share of renewable energy was 61%. Solar accounted for more than 40% of renewable electricity production this month.
May counted 74 hours with a negative power price on the EPEX market. On the imbalance market there were 159 hours with a negative price.
Because of the high number of negative hours, the full potential of wind and solar could not be used this month. The provisional estimate is that around 10% of the production potential of wind turbines and large-scale solar panel installations was curtailed as a result.
Energieopwek and EnTranCe are working on models to map this accurately. For solar, around 400 gigawatt-hours are thought to have been curtailed. For comparison: total electricity consumption in the Netherlands is around 300 gigawatt-hours per day.
April 2024
Now that spring has arrived, offshore and onshore wind turbines as well as solar panels are supplying plenty of energy. This is pushing the share of green electricity in the Netherlands to record highs. In total, almost 40% of all electricity came from wind turbines. This put pressure on prices.
April counted 62 hours with a negative power price on the EPEX market. On the imbalance market there were 208 hours with a negative price.
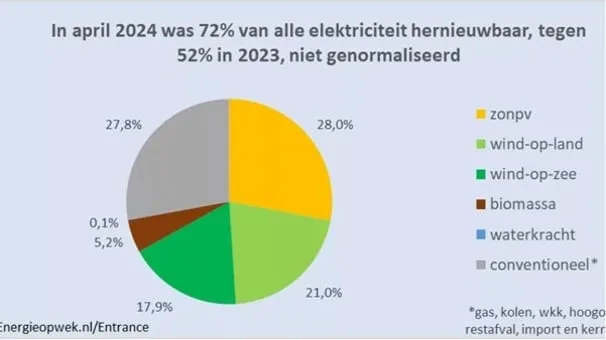
In this month, 72% of the electricity in the Netherlands came from renewable sources. In total, solar and wind supplied a quarter more energy than last year.
First quarter 2024
In the first quarter, 15% more solar energy was produced than last year. Wind production was more than 50% higher in the first quarter than last year, thanks to more wind turbines. Total quarterly renewable energy production was 17% higher.
March 2024
In March, 53% of the electricity generated was renewable, 8% higher than last year. Wind energy made the largest contribution, followed by biomass. Solar panels accounted for almost one fifth of renewable energy production this month. A number of windy periods produced some considerable peaks, supplemented by solar energy. This resulted in 17 negative price hours on the day-ahead market and 149 negative price hours on the imbalance market in March.
The rapid rise of solar and wind energy, particularly offshore, will continue in the years ahead. That is causing ever more volatility, both in day-ahead and intraday prices and in imbalance prices.
Outlook negative prices 2024-2026
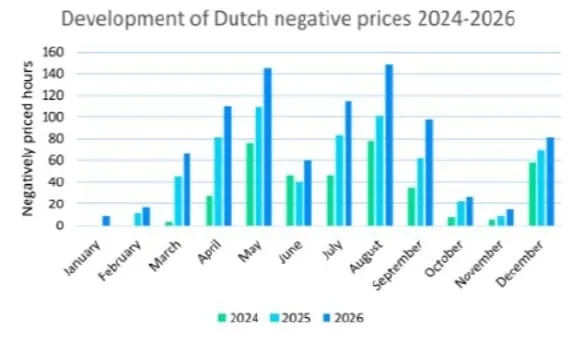
The number of negative hours will increase further because of continued growth in renewable energy, higher electricity demand due to electrification, and the phasing out of more flexible power plants.
By 2026, negative hours may triple compared with 2023. During peak hours this will mainly be due to high solar output in those hours, and during off-peak hours to wind output and lower demand. Negative prices will bring more volatility, on the day-ahead and intraday markets as well as on the imbalance market.
Increasing demand due to electrification, together with greater deployment of energy storage in batteries and via electrolysis, will have a dampening effect on the number of negative hours. Both technologies can be deployed flexibly precisely at the moments when there is an oversupply of wind and solar.
European developments: negative prices & supergrid
In more and more European countries we are seeing an increase in negative electricity prices, as a result of the large-scale stimulus for green energy in the region. This shift is being fuelled by an abundance of supply, the result of substantial investment in green infrastructure such as solar panels and wind turbines.
Source: Montel
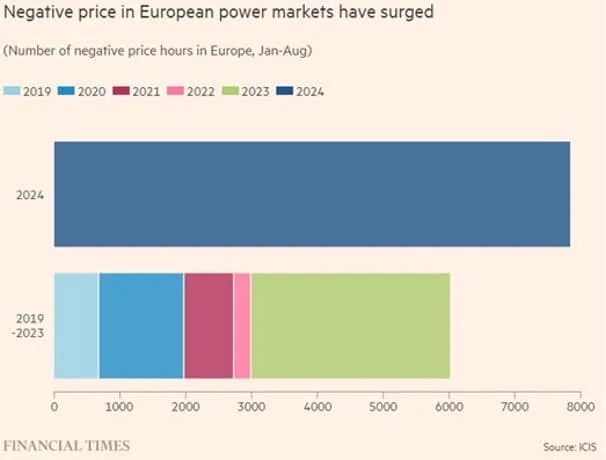
In 2023, Europe installed a record number of new solar panels, with the aim of reducing dependence on natural gas. This step followed the rise in natural gas prices in 2022, when supply was cut off by Russia. The number of negative hours will continue to rise as a result of the further growth of renewable energy, the increased demand for electricity due to electrification, and the phasing out of more flexible power plants.
By 2026, the number of negative hours may triple compared with 2023. During peak hours this increase is mainly caused by abundant solar generation, while during off-peak hours wind generation and reduced demand play a role.
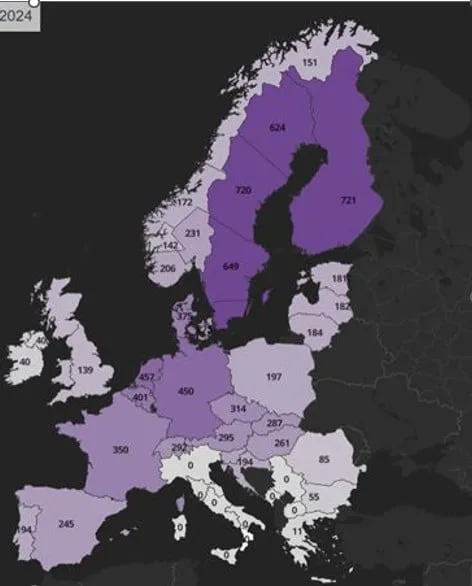
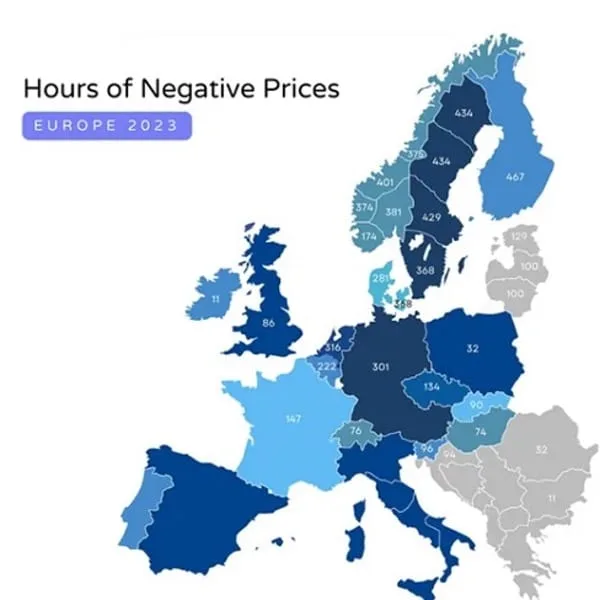
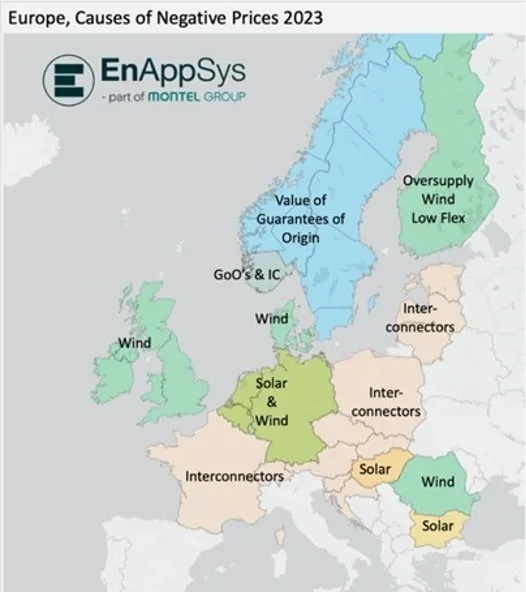
Below is the number of negative hours in 2023 per country on the day-ahead market (EPEX), with the main cause.
An overfull electricity grid in more and more European countries
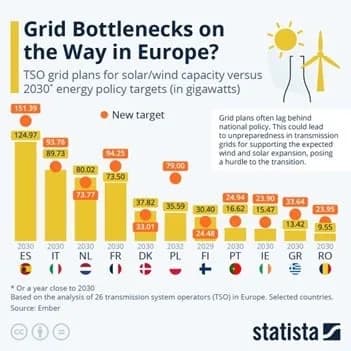
The electricity grid is becoming overfull in more and more European countries. Grid operators are unable to connect wind and solar farms to the grid. Companies applying for a connection often end up on long waiting lists.
European super grid
The synchronous electricity grid of continental Europe is the largest in the world. It serves more than 400 million customers in 24 countries. The European Commission is aiming for an integrated European electricity grid that integrates renewable energy sources, supports electrification and increases energy security. A regulatory framework will be introduced to prepare the European electricity grid for this. All cross-border bottlenecks, from planning to legal, will be mapped out. The European Investment Bank will make additional financial resources available for this future-proof energy system, the EU supergrid.
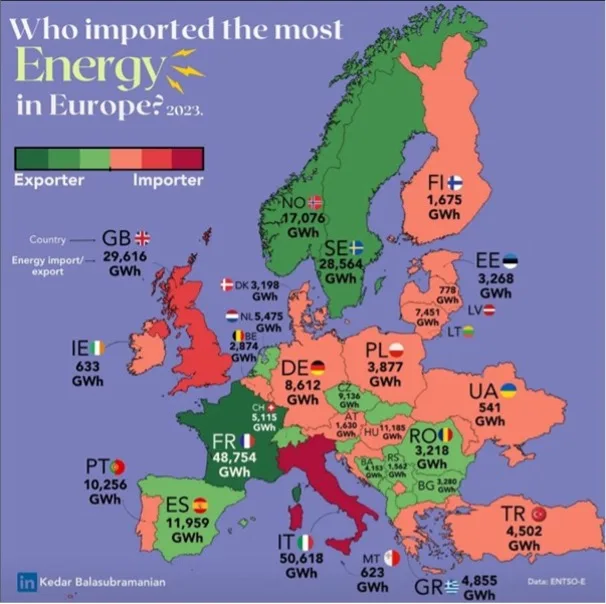
Below is an overview of the electricity flows between the various European countries in 2023.
Sources: CBS, Change.inc, EEX, Engie, Energieopwek.nl, ICIS Analytics, Nationaal Energie Dashboard, Montel, Solar Magazine, Stratergy, Tennet, Tweakers.
Solutions for negative prices
Because small-scale users can still make use of the net metering scheme for the time being, a negative power price has no consequences for them yet. However, entrepreneurs with a large-scale connection who feed electricity back into the grid at moments with a negative power price have to pay for it.
Possible solutions in this situation for dealing more intelligently with oversupply could be:
Please note: under the SDE+(+) subsidy scheme, no subsidy is paid out for the hours in which no production takes place. There are also no guarantees of origin (GOs) for those hours that can be sold to customers wanting green electricity.
- consume the electricity generated behind the meter directly, or convert it into another energy carrier
- share the electricity generated behind the meter intelligently with other companies, for example through cable pooling (different legal entities on a single connection) (MLOEA)
- store the electricity generated temporarily, for example in a battery
- switch off the solar panels temporarily, for example with a control box. A control box is connected to the inverters of your solar panels. As soon as a surplus of energy is detected on the energy market, the control box receives a signal and generation is automatically dimmed or paused temporarily. As soon as it is possible to generate electricity again, the system is reactivated automatically
In the case of a continuous period of 6 hours or longer with a negative price, no subsidy and no GOs are paid out at all.
Annual review 2023 negative prices imbalance market
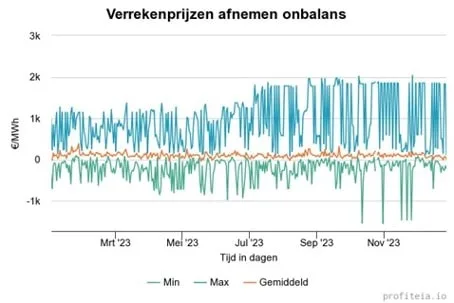
Below is an overview of the settlement prices on the imbalance market in 2023 per MWh. The prices stated are bare prices, so excluding any supplier premium or discount.
Annual review 2023 on negative power prices
A new price record, from -€1,449 per MWh to €1,852 per MWh on the imbalance market, driven by strong variation in wind. This was in the week of 27 October to 2 November. July and August were not peak months because of a lot of cloud and rainfall. As a result, there were fewer hours with negative prices. On Sunday 2 July came the first low point of 2023, with a price of -€500 per MWh. On that Sunday the price was negative for fifteen consecutive hours. A new record since April 2020. Other records in July: the power price stayed at -€500 per MWh for three hours, and for the first time there was a negative hourly price between 6.00 p.m. and 7.00 p.m. In June there were 140 hours with an electricity surplus. Even so, solar panels or wind turbines did not always have to be curtailed, because at those moments a lot of electricity was also exported to neighbouring countries. This kept the negative power prices that arose in the Netherlands limited. May was a record month. On Whit Sunday, negative power prices even occurred in the afternoon across almost the whole of North-West Europe, from Finland to France. England was the exception. There too, solar and wind will be expanded considerably in the coming years. Negative power prices traditionally occur most often in spring. In these months, solar panels generate a lot of electricity, while compared with the summer months it is also still relatively windy. For 2023, negative prices occurred occasionally at weekends or on public holidays.
Renewable energy in the Netherlands 2023
In 2023, 21 billion kWh of electricity was generated from solar energy, an increase of 24%. From biomass, 7.0 billion kWh of energy was generated, 1.7 billion less, partly because less biomass was fired in coal-fired power plants. Electricity production from fossil sources fell. Never before had so much electricity been exported.
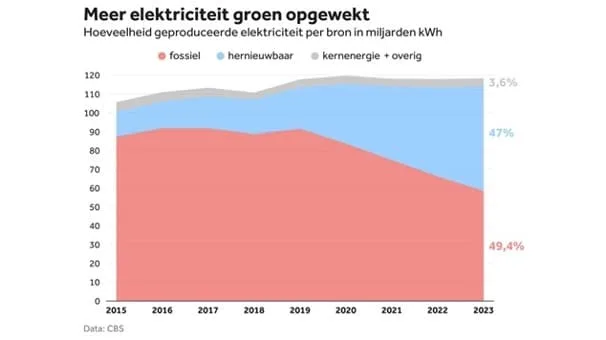
The Netherlands produced 13% more renewable energy in 2023. In electricity production, almost half of it was renewable, with solar panels supplying the most renewable electricity.
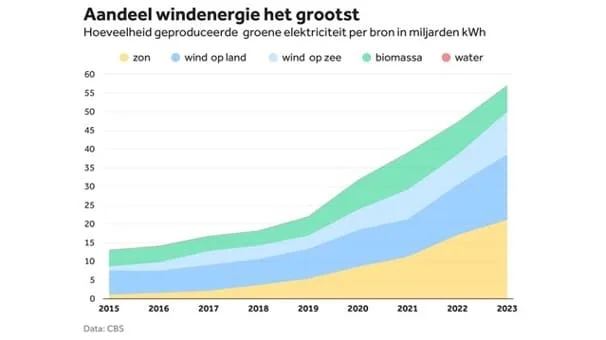
Electricity production from renewable sources rose in 2023 to 57 billion kWh. Electricity production from wind energy increased by 35%. This growth is partly due to the increase in installed capacity of onshore and offshore wind turbines (+11 GW).
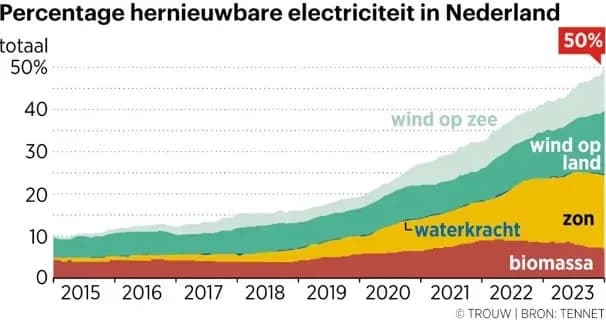
In 2023, 48% of electricity production came from renewable sources. In the period from May to July, more than half of the electricity was renewable, and in July even 57%. Production from renewable sources rose by 21% in 2023. In the final quarter, wind energy was the biggest driver of this growth.
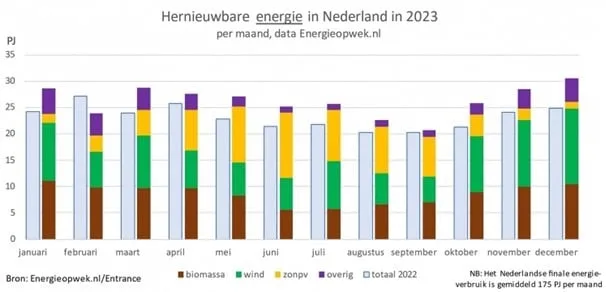
The rapid rise of solar and wind energy, particularly offshore, will continue in the years ahead. That is causing ever more volatility, both in day-ahead and intraday prices and in imbalance prices.
Electricity exports rise to a record high
In 2023, a record 25 billion kWh of electricity was exported, an increase of 10% compared with 2022. The largest share went to these countries:
Germany: 10 billion kWh (+13%), partly due to the closure of the last German nuclear power plant Belgium: 8 billion kWh United Kingdom: 4 billion kWh (+18%)
In 2023, total electricity imports rose by 5% to 19 billion kWh. Imports from Norway increased the most (1.1 billion kWh) because of higher output from Norwegian hydroelectric power plants.
On balance, more than 5.7 billion kWh of electricity was exported in 2023. This is the second year in a row in which more was exported than imported on balance.
Retrospective negative prices from 2019
The growth in storage, including batteries and electrolysers, and higher electricity consumption due to electrification are not keeping pace with the growth in renewable supply. This will cause the number of hours with negative power prices to grow further.
The growth in 2023 is due to growth in the supply of solar and wind energy, but also to a fall in electricity demand. Electricity demand fell by 5% in 2023 after having been constant for years.
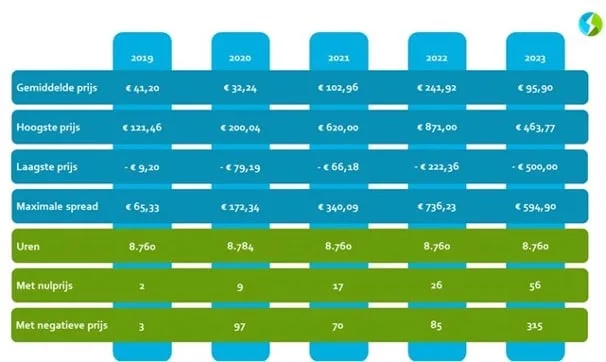
The prices stated are bare prices, so excluding any supplier premium or discount.
COMCAM advice
COMCAM can advise you on a solution that suits your situation.
If you are considering investing in solar or wind energy, make sure the expected generation matches your expected annual consumption as closely as possible.
Sources: CBS, Change.inc, EEX, Engie, Energieopwek.nl, ICIS Analytics, Nationaal Energie Dashboard, Montel, Solar Magazine, Stratergy, Tennet, Tweakers.



Does this apply to your business?
Our energy specialists are happy to look at what this means for your connections, your contract and your purchasing situation. Without obligation.